![[Translate to Global - English:]](/fileadmin/4flow/user_upload/newsroom/blog/teaser/4flow-trends-network-design-l.jpg "[Translate to Global - English:]")


From data to decisions: center of gravity analysis for optimal warehouse location
Watch 4flow webinar on demand.
Quickly gain transparency and improve supply chain planning quality with 4flow NEVA®

Businesses dependent on transportation benefit from having an agile supply chain. However, agile network design requires visibility over the entire network – a challenge without suitable software. This is where the supply chain modeling software 4flow NEVA® (Network Exploration, Visualization and Analysis) can help. It enables quick and easy interactive visualization and analysis of your baseline network structures within a few minutes.
4flow NEVA® is a user-friendly web-based application suitable for all industries and all modes of transportation.


Import data

Creation of network

Models and analysis

Costs

Throughput

Carbon footprint

Service level

Inventory

Utilization
In less than 10 minutes, 4flow NEVA® models your baseline network structure. Explore site locations, material flows, transportation lanes and regions of interest on interactive world maps, graphs and diagrams.
Based on your uploaded data, 4flow NEVA® will geocode your network sites. The geocoordinates are then used to calculate distance by road or air and transportation time between sites.

Using such key metrics as costs, transportation utilization, throughput and inventory sizes, 4flow NEVA® can evaluate your transportation network’s performance and visualize the changes over time on interactive maps, graphs and diagrams.
By reviewing your network by year, month, quarter or week, you can easily identify small but significant changes in the structure of your transportation network and solve problems as they arise.

Pinpoint bottlenecks and potential for optimization in your baseline network with 4flow NEVA®’s powerful network visualization tools. Get improvement tips for your network design and make better informed decisions more quickly with software support.

Calculate carbon emissions for shipments based on freight weight and mode of transportation. 4flow NEVA® supports effective measurement and management of greenhouse gas emissions, exhaust emissions and air pollutants, and external costs related to climate change, exhaust emissions, accidents or noise.
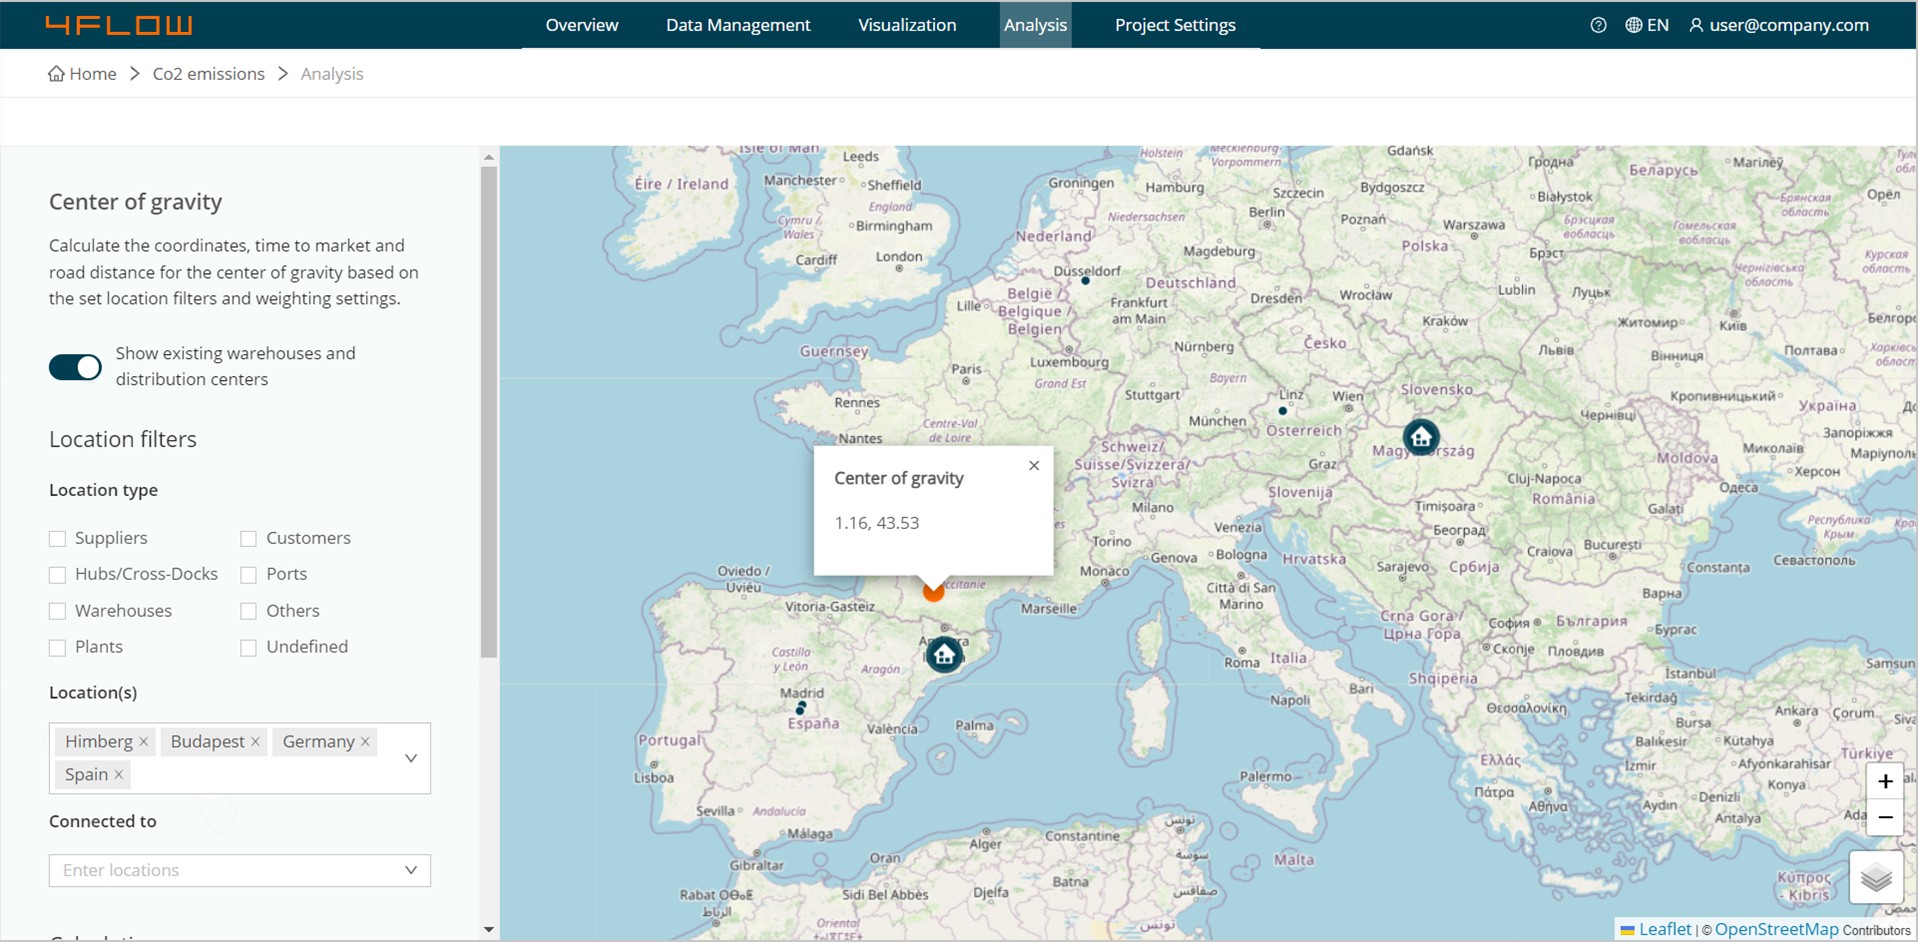
The center of gravity analysis enables you to find the ideal location for warehouse or distribution center facilities by considering transportation and demand patterns across your network.
Optimally located logistics sites empower businesses to reduce transportation costs and carbon emissions, shorten delivery times, and improve service levels.

Visualization and analysis of complex networks with thousands of lanes in minutes
Network transparency with relevant KPIs over time

Improvement tips for your supply chain network

Insight into network dynamics like changes in demand or lanes

Ready to use in less than a day

User-friendly with in-app support, user guides, online help and tutorials
Early-stage transparency improves the quality of planning and contributes to better decision making.
With 4flow NEVA®, you can improve network transparency and update stakeholders on short notice thanks to the software’s quick creation of overviews of the as-is network. Well-suited for inbound, outbound or intercompany networks, the modeling software performs center of gravity analyses to identify optimal locations for hubs or warehouses.


4flow NEVA® helps businesses review their baseline supply chain networks and consider changes like supplier locations and shipment volatility over time.
With relevant metrics like costs, transportation utilization, throughput and inventory sizes, 4flow NEVA® gives you an overview of your transportation network and lets you review details for certain suppliers or customers. By reviewing KPIs for a given time period, you can draw on various network scenarios to compare options and make better data-driven decisions to adapt quickly to changing environments.
Businesses must continuously review and optimize their supply chains in today’s dynamic markets. Identifying weaknesses in as-is networks is a smart starting point for this network design process.
With 4flow NEVA®’s powerful visualization function, you can easily reveal risks to your supply chain network, such as changes in future demand. The software suggests tips to improve your network planning to prevent and protect against risks.
Soon, 4flow NEVA® will let you identify expensive or unsustainable modes of transportation to support continuous network improvement.


Carbon emissions are becoming an increasingly important metric in supply chain networks as governments implement regulations and standards for sustainability.
4flow NEVA® measures and tracks greenhouse gases, carbon emission intensities, exhaust emission and air pollutants. In addition, the software calculates, analyzes and models related external costs, such as climate change, exhaust emission, accident and noise costs.
These functionalities provide a sustainability baseline that can be used to monitor and report progress towards sustainability goals, ensure compliance with regulatory requirements and identify potential to reduce carbon emissions.
Volatile demand, new markets and growth through M&A all require businesses to re-evaluate their current warehouse capacities and locations.
4flow NEVA®’s center of gravity analysis helps users consolidate facilities by identifying potential locations for new warehouses or distribution centers. This enables lower transportation costs and improved service levels for deliveries.

Ready for supply chain network modeling software that makes complex networks simple?
Watch 4flow webinar on demand.